
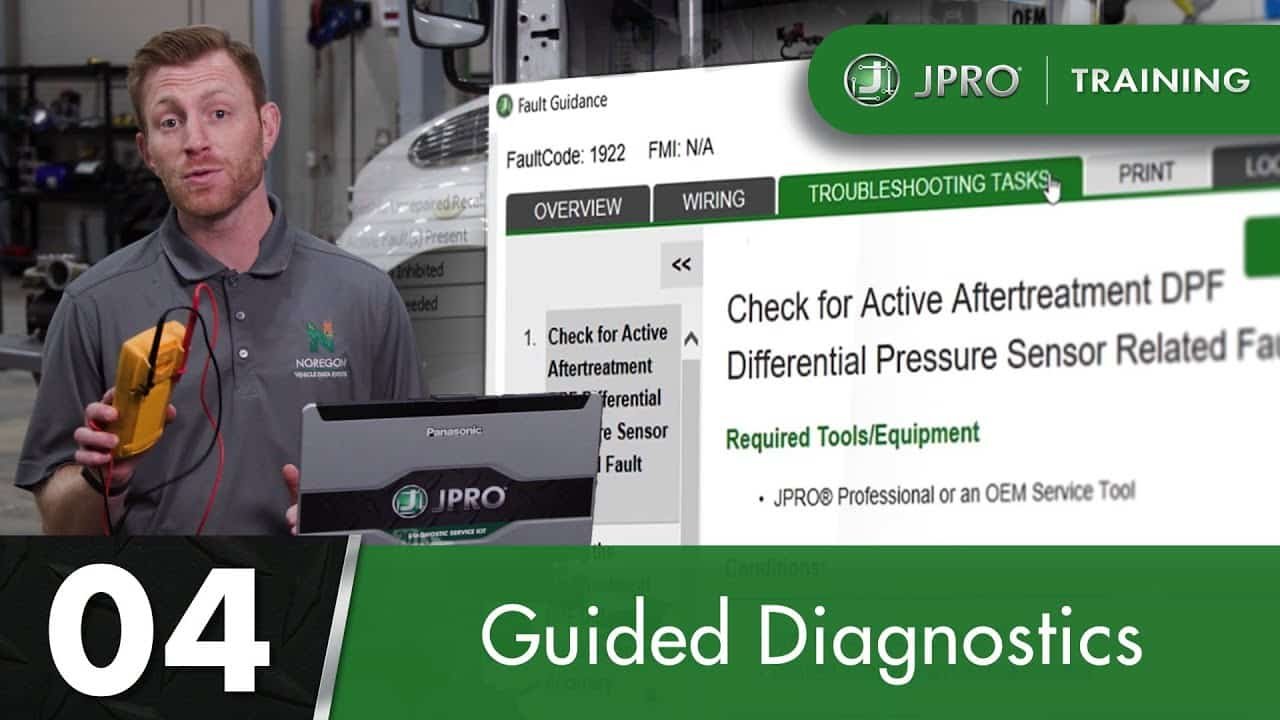
Using the 2023 JPRO Commercial Vehicle Data Monitoring Feature: Essential Guide
The JPRO Commercial Vehicle 2023 Data Monitor: A Powerful Fleet Management Tool
The JPRO Commercial Vehicle 2023 Data Monitor is essential for tracking and analyzing your fleet's vital statistics. It performs real-time monitoring of various vehicle parameters, diagnosing potential issues, optimizing fuel efficiency, and reducing maintenance costs. With this function, you can stay one step ahead of potential problems, ensuring your fleet operates smoothly.
How to Use the Data Monitor Function
The Data Monitor group's messages into related categories by tabs located at the top of the Data Monitor window.
1. Select the Data Monitor button on the main toolbar.
2. The Data Monitor window is displayed, and the initial view defaults to the All tab. The All tab displays all available data items from all components on the data bus.
Graphical Representations and Filtering
The Data Monitor window includes graphical representations and filtering options for better data visualization and analysis.
3. Other Data Monitor tabs include: Power Diagram, Faults, Temperature, Switches, Status Indicators, Pressure, Percent, Electrical, and Data Groups.
4. Filter the Data Monitor list by selecting any component from the drop-down list at the top of the window.
5. Data Monitor items can be quickly found by typing in search criteria and clicking the Search button. Results will be displayed for all items that have the search criteria in at least 1 column.
Power Diagram
The Power Diagram tab displays a graphical representation of the reported voltages for the various modules of the vehicle, aiding in the diagnosis of electrical problems.
6. Low voltages are indicated by a red blinking highlight. An indicator may display next to ECUs with electrical faults. A red exclamation indicates active faults, while a yellow triangle indicates inactive faults.
Electrical Data and Graphical Display
Selecting an ECU from the Power Diagram reveals all electrical data reported by the selected ECU. Electrical data associated avec active faults will be highlighted in red in the grid display, while data associated avec inactive faults will be highlighted in yellow.
Temperature, Switches, Status Indicators, Pressure, Percent, and Electrical Tabs
To view a graphical display of items in a specific category, select the corresponding tab.
Data Group Tab
The Data Group tab displays defined sets of data. Noregon provides pre-defined sets of data to aid in the troubleshooting of electrical problems and common performance complaints. You can also create custom user-defined sets of data.
10. Data items that are available on the current vehicle will be displayed when the named group is selected in the Data Group dropdown.
Custom User-Defined Data Group
To add a data item to a custom user-defined Data Group:
11. Select the 'Selected' checkbox on the All tab and then select the Add to Data Group button. The Add Parameters to Group window will display.
12. Provide the group name or select from the list of previously defined groups.
13. Select the OK button to add the selected data items to the selected group.
NOTE: Pre-defined Data Groups cannot be edited. Selected data items are component and protocol specific. For example, adding Battery Voltage will not automatically display Battery Voltage reported by every component. Only the selected components' Battery Voltage from the selected protocol would display in the Data Group.
After my high school studies, I decided to specialize in the automotive field. So I went to study automotive engineering in Grenoble where I obtained a master's degree in mechanical engineering for passenger vehicles.
Passionate about OBD (On-Board Diagnostic) technology, which allows drivers to diagnose their car themselves using the elaborate system embedded in their vehicles connected via Bluetooth/Wi-Fi or USB with a compatible personal computer such as Windows PC/ Linux/MacOsX such as ELM327 WiFi), I started my professional career as a technical writer after having completed several practical internships with different Lyon automobile garages in order to deepen my technical knowledge for this sector and acquire sufficient practical experience necessary that could be useful when products software achievements.
Over the years, I had developed some additional passions in particular: travel, computing (IOT & IP Networks) and Jazz music. It is thus that thanks to these additional skills enriched during all his extra-professional adventures that he was able to establish a bridge between his professional and private life offering him more equally interesting and diversified professional opportunities
I like working on complex projects linked to this fairly cutting-edge technology (preventive maintenance, advanced engine error diagnostics) because it allows me to take on stimulating technical challenges which constantly improve my skills and my expertise in this sector.
As a technical editor for Bosch France, I often had the opportunity to participate in seminars organized by their partners, suppliers or internal distributors. Thus during a professional trip to China to attend a conference on new trends in the Chinese automotive market ( 2020)
- Moteurs diesel 472 : caractéristiques et applications - January 12, 2026
- Top 3 des shampoings Tekalab pour un pré-lavage performant - July 5, 2025
- OBD 3 : ce que l’avenir réserve aux garages - June 7, 2025


Leave a Reply